You can create firewall rules that match traffic based on source or destination country to enforce geographic access policies across your network.
This is the first of the Cloudflare Advanced Network Firewall features to become available in Unified Routing. Support for additional features - IP Lists, ASN Lists, Threat Intel Lists, IDS, Rate Limiting, SIP, and Managed Rulesets - is planned.
The Container logs page now displays related Worker and Durable Object logs alongside container logs. This co-locates all relevant log events for a container application in one place, making it easier to trace requests and debug issues.
You can filter to a single source when you need to isolate Container, Worker, or Durable Object output.
Pay-as-you-go customers can now monitor usage-based costs and configure spend alerts through two new features: the Billable Usage dashboard and Budget alerts.
Billable Usage dashboard
The Billable Usage dashboard provides daily visibility into usage-based costs across your Cloudflare account. The data comes from the same system that generates your monthly invoice, so the figures match your bill.
The dashboard displays:
A bar chart showing daily usage charges for your billing period
A sortable table breaking down usage by product, including total usage, billable usage, and cumulative costs
Ability to view previous billing periods
Usage data aligns to your billing cycle, not the calendar month. The total usage cost shown at the end of a completed billing period matches the usage overage charges on your corresponding invoice.
To access the dashboard, go to Manage Account > Billing > Billable Usage.
Budget alerts
Budget alerts allow you to set dollar-based thresholds for your account-level usage spend. You receive an email notification when your projected monthly spend reaches your configured threshold, giving you proactive visibility into your bill before month-end.
To configure a budget alert:
Go to Manage Account > Billing > Billable Usage.
Select Set Budget Alert.
Enter a budget threshold amount greater than $0.
Select Create.
Alternatively, configure alerts via Notifications > Add > Budget Alert.
You can create multiple budget alerts at different dollar amounts. The notifications system automatically deduplicates alerts if multiple thresholds trigger at the same time. Budget alerts are calculated daily based on your usage trends and fire once per billing cycle when your projected spend first crosses your threshold.
Both features are available to Pay-as-you-go accounts with usage-based products (Workers, R2, Images, etc.). Enterprise contract accounts are not supported.
When a Cloudflare Worker intercepts a visitor request, it can dispatch additional outbound fetch calls called subrequests. By default, each subrequest generates its own log entry in Logpush, resulting in multiple log lines per visitor request. With subrequest merging enabled, subrequest data is embedded as a nested array field on the parent log record instead.
What's new
New subrequest_merging field on Logpush jobs — Set "merge_subrequests": true when creating or updating an http_requests Logpush job to enable the feature.
New Subrequests log field — When subrequest merging is enabled, a Subrequests field (array\<object\>) is added to each parent request log record. Each element in the array contains the standard http_requests fields for that subrequest.
Limitations
Applies to the http_requests (zone-scoped) dataset only.
A maximum of 50 subrequests are merged per parent request. Subrequests beyond this limit are passed through unmodified as individual log entries.
Subrequests must complete within 5 minutes of the visitor request. Subrequests that exceed this window are passed through unmodified.
Subrequests that do not qualify appear as separate log entries — no data is lost.
Subrequest merging is being gradually rolled out and is not yet available on all zones. Contact your account team for concerns or to ensure it is enabled for your zone.
This week's release introduces a new detection for a Remote Code Execution (RCE) vulnerability in Apache ActiveMQ (CVE-2026-34197) and an updated signature for Magento 2 - Unrestricted File Upload. Alongside these detections, we are continuing our work on rule refinements to provide deeper security insights for our customers.
Key Findings
Apache ActiveMQ (CVE-2026-34197): A vulnerability in Apache ActiveMQ allows an unauthenticated, remote attacker to execute arbitrary code. This flaw occurs during the processing of specially crafted network packets, leading to potential full system compromise.
Magento 2 - Unrestricted File Upload - 2: This is a follow-up enhancement to our existing protections for Magento and Adobe Commerce.
Impact
Successful exploitation of these vulnerabilities could allow unauthenticated attackers to execute arbitrary code or gain full administrative control over affected servers. We strongly recommend applying official vendor patches for Apache ActiveMQ and Magento to address the underlying vulnerabilities.
Continuous Rule Improvements
We are continuously refining our managed rules to provide more resilient protection and deeper insights into attack patterns. To ensure an optimal security posture, we recommend consistently monitoring the Security Events dashboard and adjusting rule actions as these enhancements are deployed.
Ruleset
Rule ID
Legacy Rule ID
Description
Previous Action
New Action
Comments
Cloudflare Managed Ruleset
N/A
Command Injection - Generic 8 - uri
Log
Block
This is a new detection. Previous description was "Command Injection - Generic 8 - uri - Beta"
Cloudflare Managed Ruleset
N/A
Command Injection - Generic 8 - body - Beta
Disabled
Disabled
This is a new detection. This rule is merged into the original rule
"Command Injection - Generic 8 - body" (ID: ). The rule previously known as "Command Injection - Generic 8" is now renamed to "Command Injection - Generic 8 - body".
Cloudflare Managed Ruleset
N/A
MySQL - SQLi - Executable Comment - Beta
Log
Block
This is a new detection. This rule is merged into the original rule
"MySQL - SQLi - Executable Comment - Body" (ID: ) The rule previously known as "MySQL - SQLi - Executable Comment" is now renamed to "MySQL - SQLi - Executable Comment - Body".
Binary frames received on a WebSocket are now delivered to the message event as Blob ↗ objects by default. This matches the WebSocket specification ↗ and standard browser behavior. Previously, binary frames were always delivered as ArrayBuffer ↗. The binaryType property on WebSocket controls the delivery type on a per-WebSocket basis.
This change has been active for Workers with compatibility dates on or after 2026-03-17, via the websocket_standard_binary_type compatibility flag. We should have documented this change when it shipped but didn't. We're sorry for the trouble that caused. If your Worker handles binary WebSocket messages and assumes event.data is an ArrayBuffer, the frames will arrive as Blob instead, and a naive instanceof ArrayBuffer check will silently drop every frame.
To opt back into ArrayBuffer delivery, assign binaryType before calling accept(). This works regardless of the compatibility flag:
const resp = await fetch("https://example.com", { headers: { Upgrade: "websocket" },});const ws = resp.webSocket;// Opt back into ArrayBuffer delivery for this WebSocket.ws.binaryType = "arraybuffer";ws.accept();ws.addEventListener("message", (event) => { if (typeof event.data === "string") { // Text frame. } else { // event.data is an ArrayBuffer because we set binaryType above. }});
If you are not ready to migrate and want to keep ArrayBuffer as the default for all WebSockets in your Worker, add the no_websocket_standard_binary_type flag to your Wrangler configuration file.
This change has no effect on the Durable Object hibernatable WebSocket webSocketMessage handler, which continues to receive binary data as ArrayBuffer.
The new Network session analytics dashboard is now available in Cloudflare One. This dashboard provides visibility into your network traffic patterns, helping you understand how traffic flows through your Cloudflare One infrastructure.
What you can do with Network session analytics
Analyze geographic distribution: View a world map showing where your network traffic originates, with a list of top locations by session count.
Monitor key metrics: Track session count, total bytes transferred, and unique users.
Identify connection issues: Analyze connection close reasons to troubleshoot network problems.
Review protocol usage: See which network protocols (TCP, UDP, ICMP) are most used.
Dashboard features
Summary metrics: Session count, bytes total, and unique users
Traffic by location: World map visualization and location list with top traffic sources
Top protocols: Breakdown of TCP, UDP, ICMP, and ICMPv6 traffic
Connection close reasons: Insights into why sessions terminated (client closed, origin closed, timeouts, errors)
Logpush has traditionally been great at delivering Cloudflare logs to a variety of destinations in JSON format. While JSON is flexible and easily readable, it can be inefficient to store and query at scale.
With this release, you can now send your logs directly to Pipelines to ingest, transform, and store your logs in R2 as Parquet files or Apache Iceberg tables managed by R2 Data Catalog. This makes the data footprint more compact and more efficient at querying your logs instantly with R2 SQL or any other query engine that supports Apache Iceberg or Parquet.
Transform logs before storage
Pipelines SQL runs on each log record in-flight, so you can reshape your data before it is written. For example, you can drop noisy fields, redact sensitive values, or derive new columns:
INSERT INTO http_logs_sinkSELECT ClientIP, EdgeResponseStatus, to_timestamp_micros(EdgeStartTimestamp) AS event_time, upper(ClientRequestMethod) AS method, sha256(ClientIP) AS hashed_ipFROM http_logs_streamWHERE EdgeResponseStatus >= 400;
Pipelines SQL supports string functions, regex, hashing, JSON extraction, timestamp conversion, conditional expressions, and more. For the full list, refer to the Pipelines SQL reference.
R2 SQL now supports functions for querying JSON data stored in Apache Iceberg tables, an easier way to parse query plans with EXPLAIN FORMAT JSON, and querying tables without partition keys stored in R2 Data Catalog.
JSON functions extract and manipulate JSON values directly in SQL without client-side processing:
SELECT json_get_str(doc, 'name') AS name, json_get_int(doc, 'user', 'profile', 'level') AS level, json_get_bool(doc, 'active') AS is_activeFROM my_namespace.sales_dataWHERE json_contains(doc, 'email')
For a full list of available functions, refer to JSON functions.
EXPLAIN FORMAT JSON returns query execution plans as structured JSON for programmatic analysis and observability integrations:
Unpartitioned Iceberg tables can now be queried directly, which is useful for smaller datasets or data without natural time dimensions. For tables with more than 1000 files, partitioning is still recommended for better performance.
Introducing enhanced archiving capabilities for security action items within the Security Overview dashboard. This update allows security teams to maintain a cleaner workspace by removing resolved, accepted, or irrelevant items from their active list while maintaining a clear paper trail for compliance.
Why this matters
Managing a high volume of security insights can be overwhelming. Previously, users lacked a structured way to dismiss items without losing the context of why they were ignored.
With these new archiving options—False Positive, Accept Risk, and Other—you can now suppress items indefinitely with required rationale text for risk-based decisions. This ensures that your team remains focused on critical, actionable vulnerabilities while preserving institutional knowledge for audits.
Key features
Structured Archiving: Choose from specific categories to define why an action item is being moved.
Required Rationale: For "Accept Risk" and "Other" categories, users must provide documentation, ensuring accountability for security decisions.
Audit Log Transparency: New API endpoints allow you to programmatically retrieve the history of status changes and rationale for any insight at the account or zone level.
Reversible Actions: Any archived item can be moved back to the active list at any time if the security context changes.
:::note
Archiving a suspicious activity item will remove it from the Security Overview page, but the activity will remain visible in your Security Analytics dashboard for deeper forensic analysis.
:::
Example: Retrieve audit logs via API
To review the history and rationale of a specific archived issue at the account level, you can use the following API command:
@cf/moonshotai/kimi-k2.6 is now available on Workers AI, in partnership with Moonshot AI for Day 0 support. Kimi K2.6 is a native multimodal agentic model from Moonshot AI that advances practical capabilities in long-horizon coding, coding-driven design, proactive autonomous execution, and swarm-based task orchestration.
Built on a Mixture-of-Experts architecture with 1T total parameters and 32B active per token, Kimi K2.6 delivers frontier-scale intelligence with efficient inference. It scores competitively against GPT-5.4 and Claude Opus 4.6 on agentic and coding benchmarks, including BrowseComp (83.2), SWE-Bench Verified (80.2), and Terminal-Bench 2.0 (66.7).
Key capabilities
262.1k token context window for retaining full conversation history, tool definitions, and codebases across long-running agent sessions
Long-horizon coding with significant improvements on complex, end-to-end coding tasks across languages including Rust, Go, and Python
Coding-driven design that transforms simple prompts and visual inputs into production-ready interfaces and full-stack workflows
Agent swarm orchestration scaling horizontally to 300 sub-agents executing 4,000 coordinated steps for complex autonomous tasks
Vision inputs for processing images alongside text
Thinking mode with configurable reasoning depth
Multi-turn tool calling for building agents that invoke tools across multiple conversation turns
Differences from Kimi K2.5
If you are migrating from Kimi K2.5, note the following API changes:
K2.6 uses chat_template_kwargs.thinking to control reasoning, replacing chat_template_kwargs.enable_thinking
K2.6 returns reasoning content in the reasoning field, replacing reasoning_content
Get started
Use Kimi K2.6 through the Workers AI binding (env.AI.run()), the REST API at /ai/run, or the OpenAI-compatible endpoint at /v1/chat/completions. You can also use AI Gateway with any of these endpoints.
MCP server portals display a homepage when users visit the portal domain in a browser.
The homepage shows:
The portal name and organization branding
The MCP endpoint URL with a copy button
Per-client connection instructions for Claude Desktop, Workers AI Playground, OpenCode, Windsurf, and other MCP clients
Authenticated users see their email address and a Sign out button. Selecting Sign out revokes all portal-level OAuth grants, deletes upstream server OAuth states, and redirects through Cloudflare Access logout. A confirmation page shows a summary of the revoked sessions.
Cloudflare's network now supports redirecting verified AI training crawlers to canonical URLs when they request deprecated or duplicate pages. When enabled via AI Crawl Control > Quick Actions, AI training crawlers that request a page with a canonical tag pointing elsewhere receive a 301 redirect to the canonical version. Humans, search engine crawlers, and AI Search agents continue to see the original page normally.
This feature leverages your existing <link rel="canonical"> tags. No additional configuration required beyond enabling the toggle. Available on Pro, Business, and Enterprise plans at no additional cost.
AI Crawl Control now includes new tools to help you prepare your site for the agentic Internet—a web where AI agents are first-class citizens that discover and interact with content differently than human visitors.
Content Format insights
The Metrics tab now includes a Content Format chart showing what content types AI systems request versus what your origin serves. Understanding these patterns helps you optimize content delivery for both human and agent consumption.
Directives tab (formerly Robots.txt)
The Robots.txt tab has been renamed to Directives and now includes a link to check your site's Agent Readiness ↗ score.
You can now achieve higher cache HIT rates and reduce origin load for origins hosted on public cloud providers with Smart Tiered Cache. By setting a cloud region hint for your origin, Cloudflare selects the optimal upper-tier data center for that cloud region, funneling all cache MISSes through a single location close to your origin.
Previously, Smart Tiered Cache could not reliably select an optimal upper tier for origins behind anycast or regional unicast networks commonly used by cloud providers. Origins on AWS, GCP, Azure, and Oracle Cloud would fall back to a multi-upper-tier topology, resulting in lower cache HIT rates and more requests reaching your origin.
How it works
Set a cloud region hint (for example, aws/us-east-1 or gcp/europe-west1) for your origin IP or hostname. Smart Tiered Cache uses this hint along with real-time latency data to select a primary upper tier close to your cloud region, plus a fallback in a different location for resilience.
Supported providers: AWS, GCP, Azure, and Oracle Cloud.
All plans: Available on Free, Pro, Business, and Enterprise plans at no additional cost.
Dashboard and API: Configure from Caching > Tiered Cache > Origin Configuration, or use the API and Terraform.
Radar adds three new features to the AI Insights ↗ page, expanding visibility into how AI bots, crawlers, and agents interact with the web.
Adoption of AI agent standards
The AI Insights page now includes an adoption of AI agent standards ↗ widget that tracks how websites adopt agent-facing standards. The data is filterable by domain category and updated weekly on Mondays.
This data is also available through the Agent Readiness API reference.
A new savings gauge ↗ shows the median response-size reduction when serving Markdown instead of HTML to AI bots and crawlers. This highlights the bandwidth and token savings that Markdown for Agents provides.
The new response status widget ↗ displays the distribution of HTTP response status codes returned to AI bots and crawlers. Results are groupable by individual status code (200, 403, 404) or by category (2xx, 3xx, 4xx, 5xx).
The same widget is available on each verified bot's detail page (only available for AI bots), for example Google ↗.
New AI Search instances created after today will work differently. New instances come with built-in storage and a vector index, so you can upload a file, have it indexed immediately, and search it right away.
Additionally new Workers Bindings are now available to use with AI Search. The new namespace binding lets you create and manage instances at runtime, and cross-instance search API lets you query across multiple instances in one call.
Built-in storage and vector index
All new instances now comes with built-in storage which allows you to upload files directly to it using the Items API or the dashboard. No R2 buckets to set up, no external data sources to connect first.
const instance = env.AI_SEARCH.get("my-instance");// upload and wait for indexing to completeconst item = await instance.items.uploadAndPoll("faq.md", content);// search immediately after indexingconst results = await instance.search({ messages: [{ role: "user", content: "onboarding guide" }],});
Namespace binding
The new ai_search_namespaces binding replaces the previous env.AI.autorag() API provided through the AI binding. It gives your Worker access to all instances within a namespace and lets you create, update, and delete instances at runtime without redeploying.
Within the new AI Search binding, you now have access to a Search and Chat API on the namespace level. Pass an array of instance IDs and get one ranked list of results back.
AI Search now supports hybrid search and relevance boosting, giving you more control over how results are found and ranked.
Hybrid search
Hybrid search combines vector (semantic) search with BM25 keyword search in a single query. Vector search finds chunks with similar meaning, even when the exact words differ. Keyword search matches chunks that contain your query terms exactly. When you enable hybrid search, both run in parallel and the results are fused into a single ranked list.
You can configure the tokenizer (porter for natural language, trigram for code), keyword match mode (and for precision, or for recall), and fusion method (rrf or max) per instance:
Relevance boosting lets you nudge search rankings based on document metadata. For example, you can prioritize recent documents by boosting on timestamp, or surface high-priority content by boosting on a custom metadata field like priority.
Configure up to 3 boost fields per instance or override them per request:
Artifacts is now in private beta. Artifacts is Git-compatible storage built for scale: create tens of millions of repos, fork from any remote, and hand off a URL to any Git client. It provides a versioned filesystem for storing and exchanging file trees across Workers, the REST API, and any Git client, running locally or within an agent.
You can read the announcement blog ↗ to learn more about what Artifacts does, how it works, and how to create repositories for your agents to use.
Artifacts has three API surfaces:
Workers bindings (for creating and managing repositories)
REST API (for creating and managing repos from any other compute platform)
Git protocol (for interacting with repos)
As an example: you can use the Workers binding to create a repo and read back its remote URL:
# Create a thousand, a million or ten million repos: one for every agent, for every upstream branch, or every user.const created = await env.PROD_ARTIFACTS.create("agent-007");const remote = (await created.repo.info())?.remote;
Or, use the REST API to create a repo inside a namespace from your agent(s) running on any platform:
Any Git client that speaks smart HTTP can use the returned remote URL:
# Agents know git.# Every repository can act as a git repo, allowing agents to interact with Artifacts the way they know best: using the git CLI.git clone https://x:${REPO_TOKEN}@artifacts.cloudflare.net/some-namespace/agent-007.git
Email Sending is now in public beta. Send transactional emails directly from Workers (env.EMAIL.send()) or the REST API, with support for HTML, plain text, attachments, inline images, and custom headers. Email Sending joins Email Routing ↗ under the new Cloudflare Email Service — a single service for sending and receiving email on the Cloudflare developer platform.
Send an email from a Worker in a few lines of code:
src/index.jsjs
export default { async fetch(request, env) { const response = await env.EMAIL.send({ from: "notifications@yourdomain.com", to: "user@example.com", subject: "Order confirmed", html: "<h1>Your order has been confirmed</h1>", text: "Your order has been confirmed.", }); return Response.json({ messageId: response.messageId }); },};
src/index.tsts
export default { async fetch(request, env): Promise<Response> { const response = await env.EMAIL.send({ from: "notifications@yourdomain.com", to: "user@example.com", subject: "Order confirmed", html: "<h1>Your order has been confirmed</h1>", text: "Your order has been confirmed.", }); return Response.json({ messageId: response.messageId }); },} satisfies ExportedHandler<Env>;
Email Service also integrates with the Agents SDK, giving your agents a native onEmail hook to receive, process, and reply to emails. Combined with the new Email MCP server ↗ and Wrangler CLI email commands, any agent can send email regardless of where it runs.
Start sending and receiving emails from Workers and agents today. Email Sending is available on the Workers paid plan. Refer to the Email Service documentation to get started.
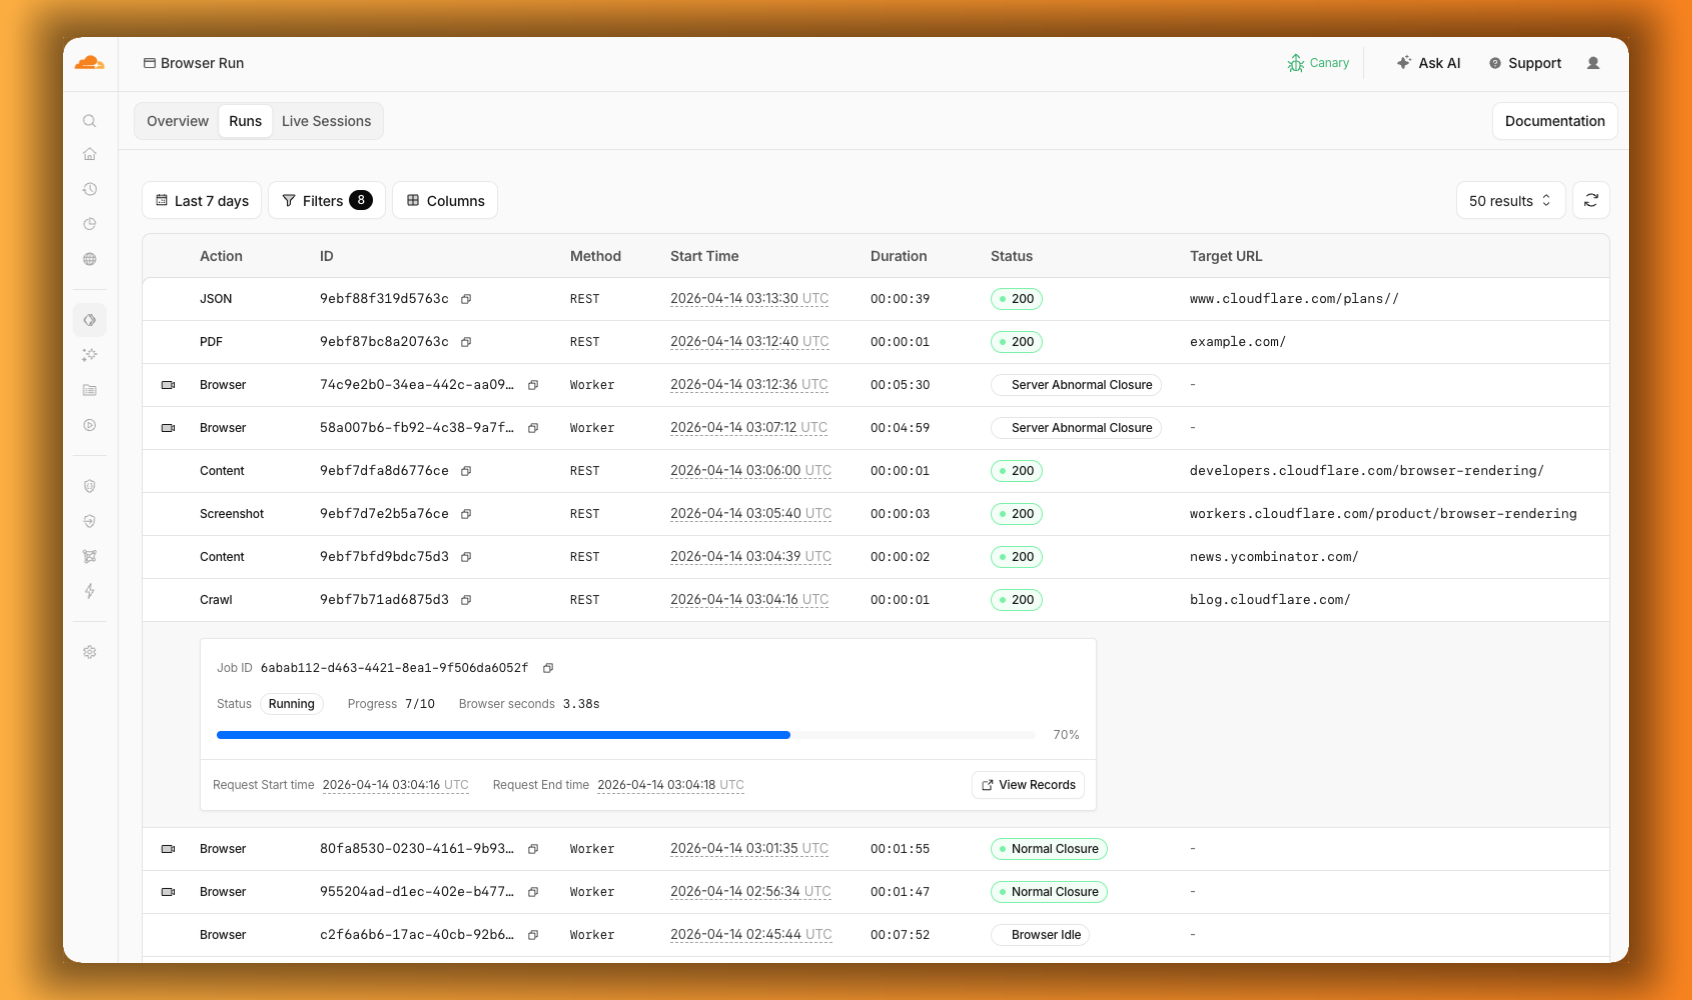
We are renaming Browser Rendering to Browser Run. The name Browser Rendering never fully captured what the product does. Browser Run lets you run full browser sessions on Cloudflare's global network, drive them with code or AI, record and replay sessions, crawl pages for content, debug in real time, and let humans intervene when your agent needs help.
Along with the rename, we have increased limits for Workers Paid plans and redesigned the Browser Run dashboard.
We have 4x-ed concurrency limits for Workers Paid plan users:
Concurrent browsers per account: 30 → 120 per account
New browser instances: 30 per minute → 1 per second
Rate limits across the limits page are now expressed in per-second terms, matching how they are enforced. No action is needed to benefit from the higher limits.
The redesigned dashboard ↗ now shows every request in a single Runs tab, not just browser sessions but also quick actions like screenshots, PDFs, markdown, and crawls. Filter by endpoint, view target URLs, status, and duration, and expand any row for more detail.
When browser automation fails or behaves unexpectedly, it can be hard to understand what happened. We are shipping three new features in Browser Run (formerly Browser Rendering) to help:
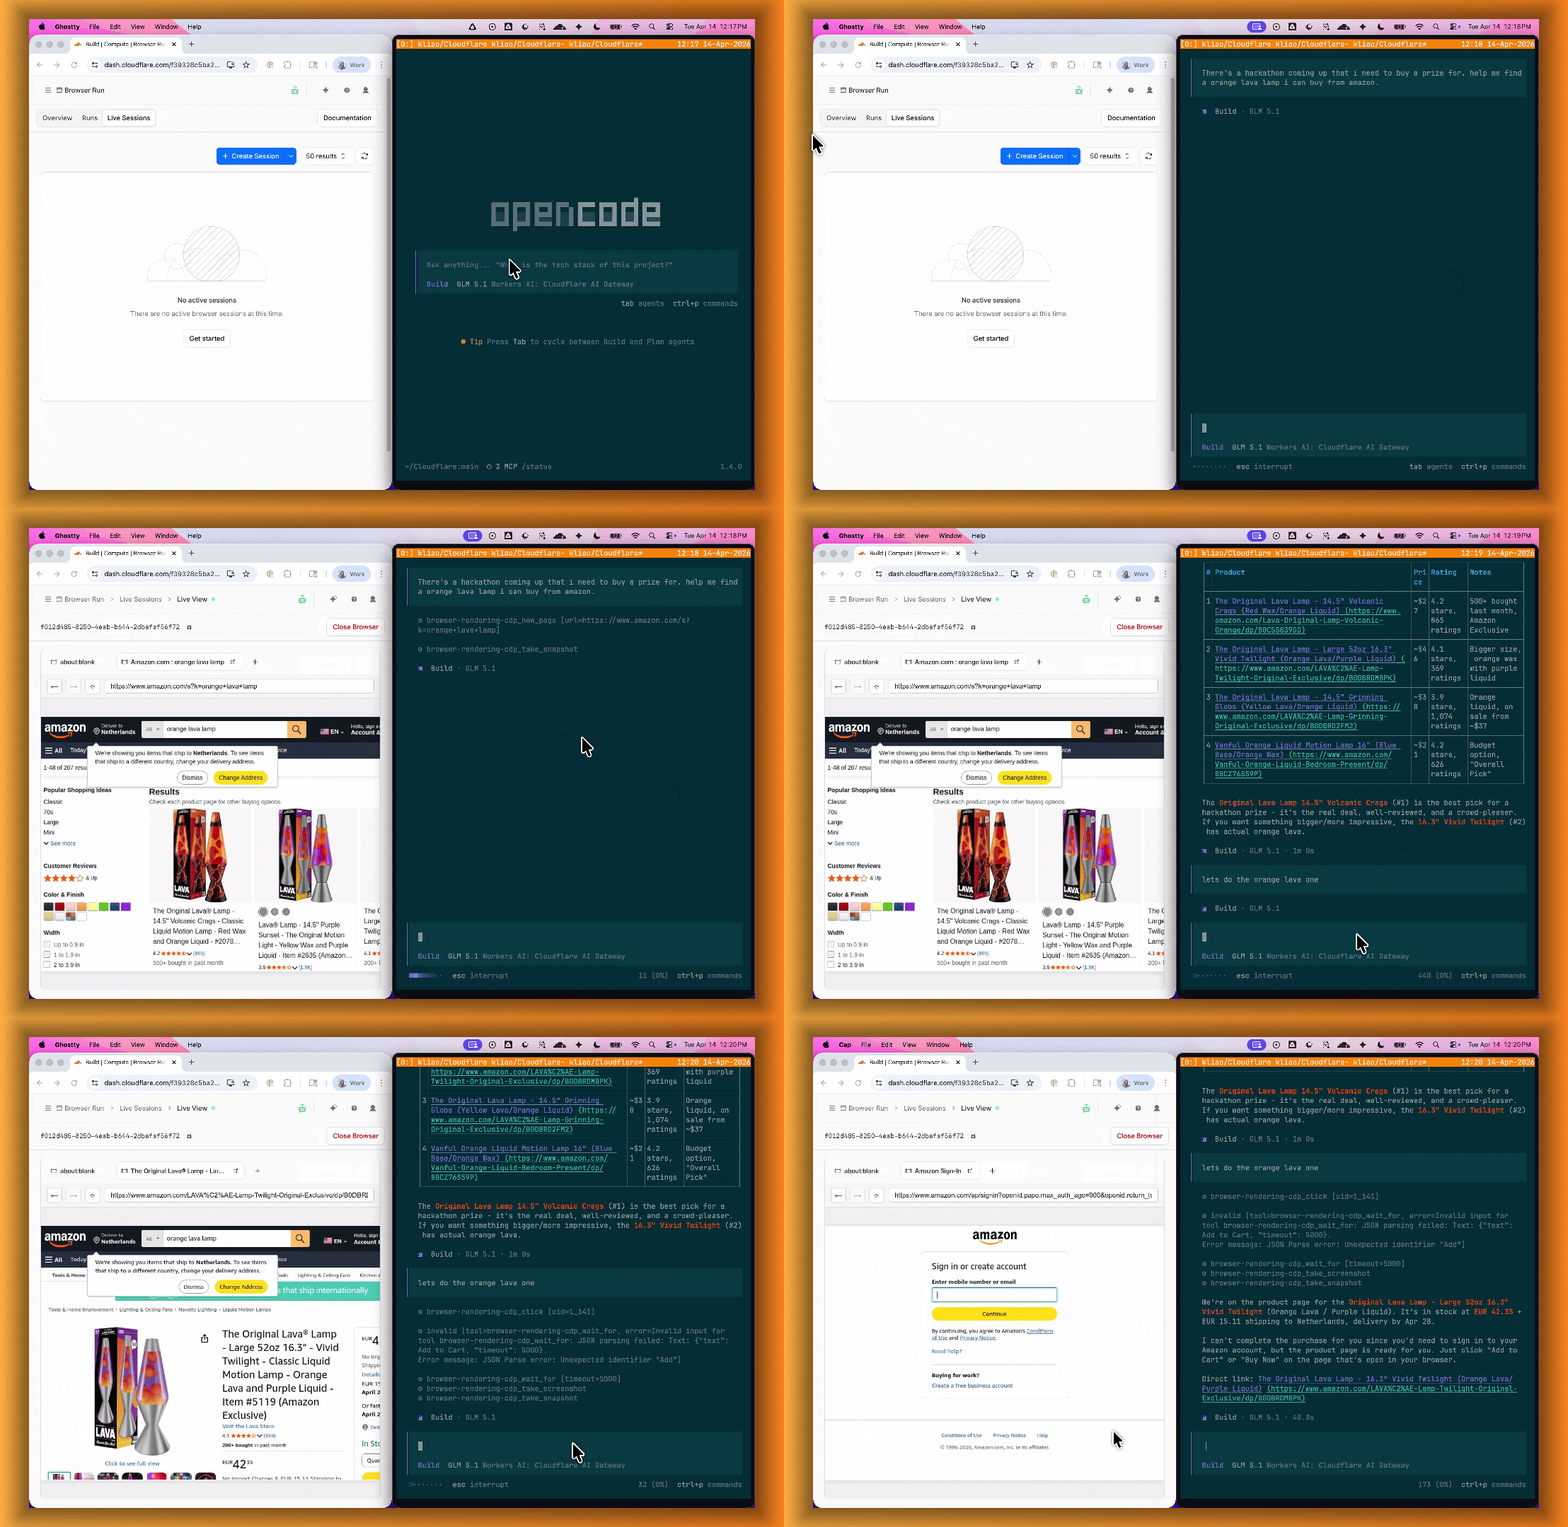
Live View lets you see what your agent is doing in real time. The page, DOM, console, and network requests are all visible for any active browser session. Access Live View from the Cloudflare dashboard, via the hosted UI at live.browser.run, or using native Chrome DevTools.
Human in the Loop
When your agent hits a snag like a login page or unexpected edge case, it can hand off to a human instead of failing. With Human in the Loop, a human steps into the live browser session through Live View, resolves the issue, and hands control back to the script.
Today, you can step in by opening the Live View URL for any active session. Next, we are adding a handoff flow where the agent can signal that it needs help, notify a human to step in, then hand control back to the agent once the issue is resolved.
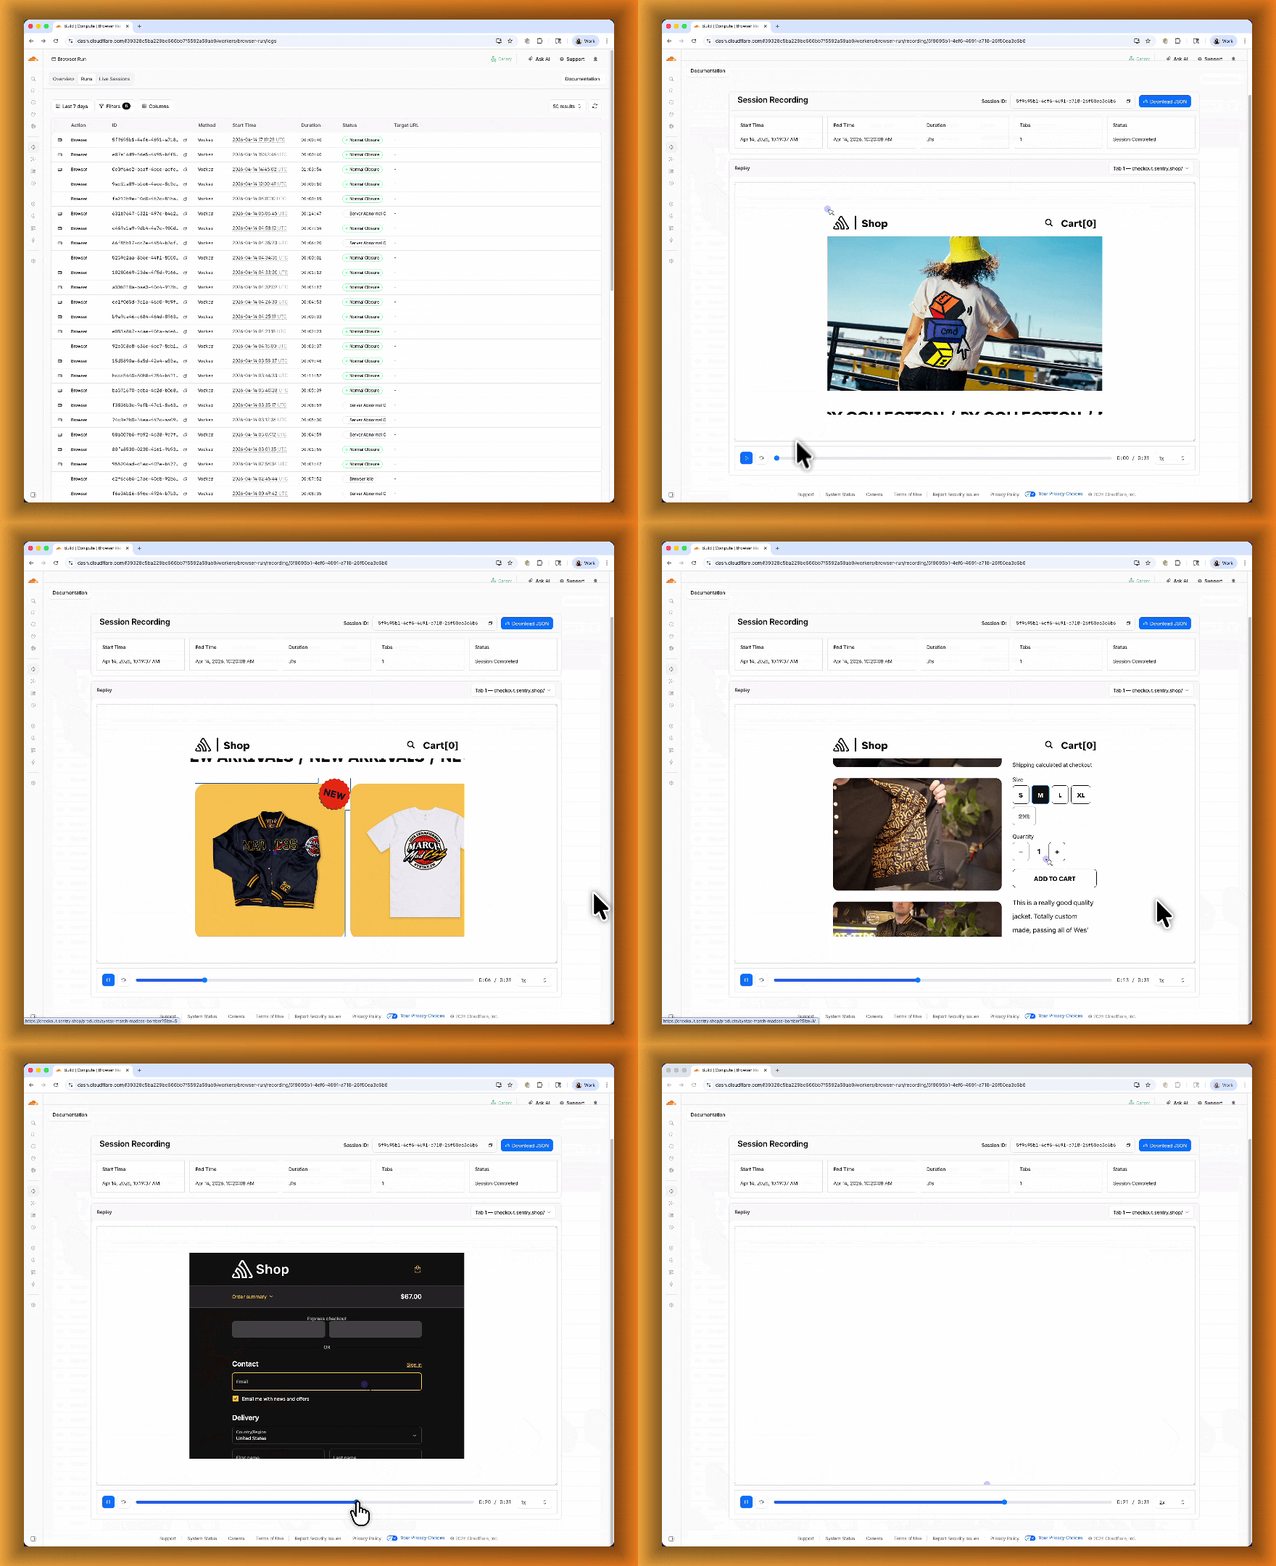
Session Recordings
Session Recordings records DOM state so you can replay any session after it ends. Enable recordings by passing recording: true when launching a browser. After the session closes, view the recording in the Cloudflare dashboard under Browser Run > Runs, or retrieve via API using the session ID. Next, we are adding the ability to inspect DOM state and console output at any point during the recording.